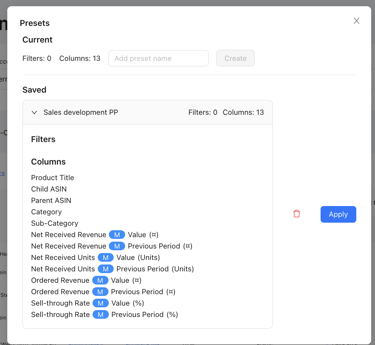
With our product performance dashboard, you can create custom columns tailored to your needs. Additionally, it provides you with sorting and filtering options, similar to Excel, for efficient data analysis. Save your preferred views for easy access.
Table of content
Filter options:
- Marketplace
Choose which marketplace you would want to see your selected date
- SP-API Account
Choose which marketplace you would want to see advertising data - View & Date
Filter the time range and date you want to analyze - Currency
Choose the currency in which you would like to see your data - Tag
Select one or multiple tags for detailed analysis
Please note that if you have multiple Marketplaces, for the filter "Marketplace" and "SP-API Account", all marketplaces will be displayed per default in the table if no marketplace is chosen.
KPIs
In this extensive dashboard, you can track critical KPIs such as Bestseller Rank, Sellable Inventory, Conversion Rate, Shipped Revenue, Ad Sales, Click-Throughs, and Procurable Product out of Stock Rate. Moreover, you have the flexibility to filter data based on manufacturing or sourcing levels and choose the attribution window you prefer for review, ensuring a tailored and insightful analysis.
View options:
You can view data at four different levels—ASIN, Parent ASIN, Sub-Category, and Category — allowing you to focus on specific identifiers for comprehensive analysis.

Get Started
-
Create Your Custom Table:
Begin by selecting the metrics and KPIs you want to include in your dashboard. Customize the layout to suit your preferences, arranging columns and rows to display the data most effectively.
-
Explore Multi-Country Insights:
Take advantage of our multi-country overview to gain a comprehensive understanding of your performance on a global scale. Compare data from different regions to identify patterns and areas for improvement.

-
Utilize Sorting and Filtering:
Enhance your data exploration experience by utilizing the sorting and filtering functionalities. Arrange your data to focus on specific criteria and narrow down your view to extract meaningful insights.
-
Save Your Custom Table (Presets):
Once you've configured your dashboard to your liking, save your custom views for future reference. This feature ensures that you can easily access your preferred settings whenever you need them, streamlining your reporting process.
Use Cases
- The Sales performance is dropping or not growing MoM?
Make sure to select your Sales Data, Traffic, Conversion Rate, Instock, Buy Box and Sales Rank to understand which factor could be potentially causing the sales drop.
Compare your numbers with Previous Year Data (Previous year meaning the same timeframe last year eg. April 2024 vs April 2023), to see if the drop is maybe based on a low season, or if the drop is unusual and the sales should be higher.
- Understand which Categories or Subcategories are performing good or bad
Select your Sales KPIs and start analyzing the numbers, based on your benchmarks.
To understand which ASINs are underperforming, we suggest using the filter options, and select ASINs that are below your benchmarks.

