Try it in the tool:
- Time Rage Comparison Report (Vendor)
- Time Range Comparison Report (Seller)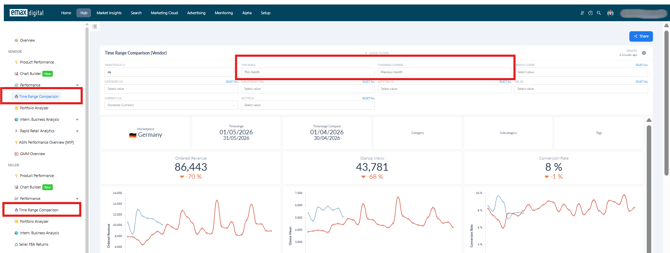
Benefits
- Compare two custom time ranges side by side
- Daily data sets to compare week over week, month over month or year over year
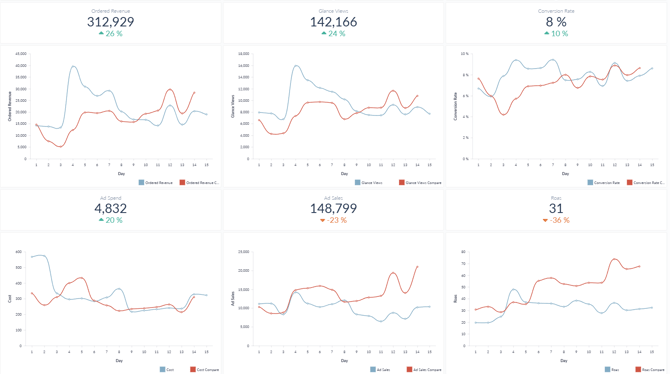
- Performance review on ASIN Level: sales, traffic, and advertising performance changes
- Track changes in Buy Box percentage for Seller accounts
- Winner & Loser: Identify winning and losing products based on absolute data or percentage change
- Event Prep & Analysis: Analyze performance for key retail events such as Black Friday, Prime Day, and Spring Deals
Available KPIs
- Product Sales
- Glance Views (Page Views)
- Conversion Rate
- Ad Spend
- Ad Sales
- ROAS
- New: Buy Box Percentage, available for Seller accounts
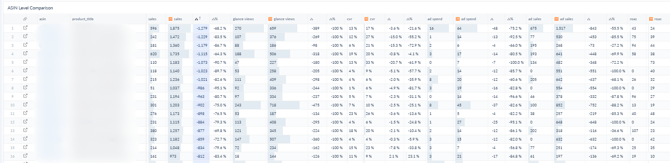
Product-Level Insights
The report shows results on product or ASIN level. For each product, you can compare performance between Time Range 1 and Time Range 2. The report also displays the absolute change and percentage change for each KPI, making it easy to see which products improved, declined, or stayed stable between the selected periods.