1. Where to find the Dashboard
2. What can you see in the International Business Analysis
a. General Overview Intl. Business analysis
b. Revenue
c. Units
d. Traffic, ASP, Returns and NetPPM Overview
e. Inventory
Where to find the Dashboard
As a Vendor with Multi-Marketplaces, you can find the International Business Analysis Dashboard in the Hub.
In case you are not seeing the International Business Analysis, please reach out to your Account Manager or support@emax-digital.com.
What can you see in the International Business Analysis:
The international business analysis dashboard offers users a comprehensive view of accumulated performance across all marketplaces, with graphical representations, interactive tools, and drilldown options for analyzing revenue, units, traffic, returns, Net ppm, and inventory, enabling informed decision-making and strategy optimization.
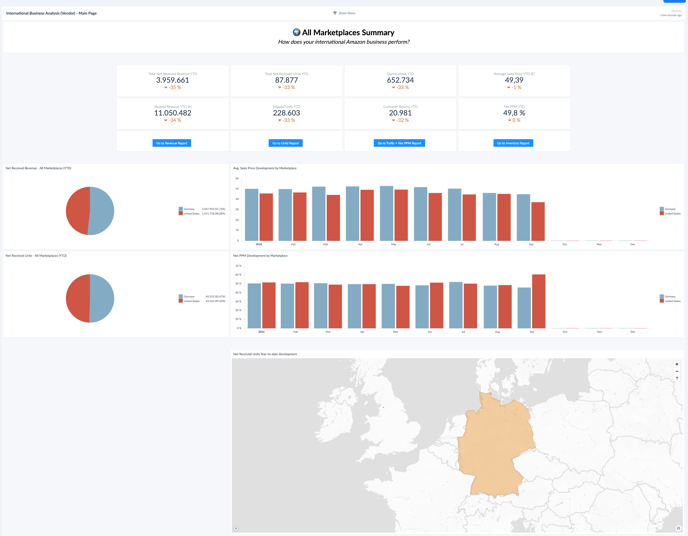
1. General Overview Intl. Business analysis
At the top level, the dashboard presents a general overview of the most important KPIs. This includes:
-
Net Received Units (NRU)
-
Revenue
- A world map displaying active marketplaces where your business operates.
By hovering over the map, you can see detailed data for each marketplace. This provides an intuitive way to quickly assess the performance of different regions and markets.
Use Case: Instantly identify which markets are performing well, and which regions may need more focus or strategy adjustments. It’s a great tool for high-level, at-a-glance insights.
2. Revenue
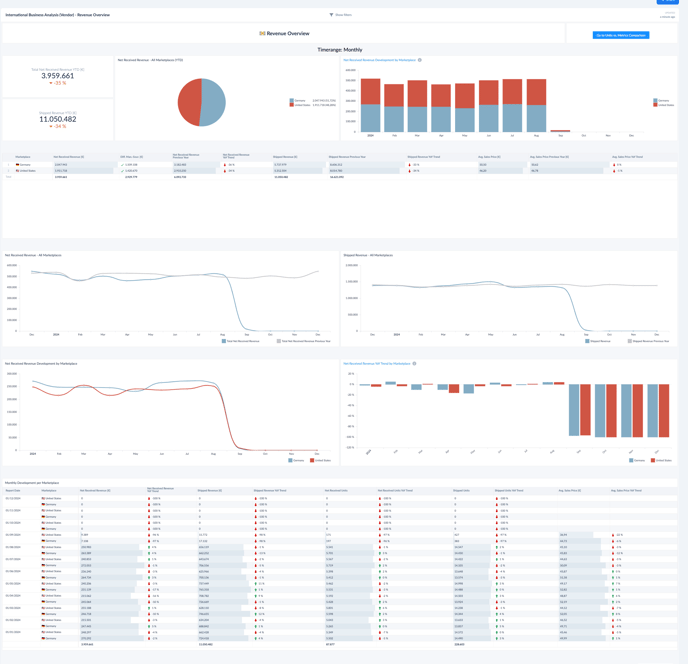
The Revenue section offers a deeper dive into the financial performance with a more granular view of key metrics:
- Net Received Revenue (NRR)
- Net Revenue per Unit (NRU)
- Shipped Revenue graph
- Month-on-Month (MoM) Development Table
The graph visualizes the trend in shipped revenue, while the MoM table provides a comparative view of performance over time.
Use Case:
- Spot trends in your revenue performance, identify high- and low-performing periods, and adjust advertising, promotions, or pricing to optimize future earnings.
- Recognize trends, understand seasonal variations, and make data-driven decisions to capitalize on upcoming opportunities or to address potential sales challenges.
3. Units
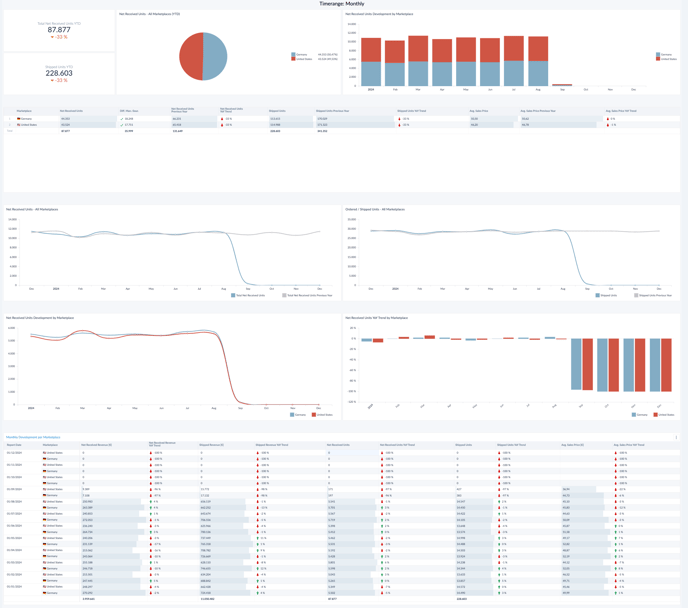
The Units section follows a similar structure to the Revenue overview, focusing on units rather than financial figures:
- Net Received Units (NRU)
- Shipped Units graph
- Month-on-Month (MoM) Development Table
The MoM table helps identify unit growth or declines, while the graph tracks the overall trend in shipped units, giving insight into the efficiency of your product delivery and sales.
Use Case:
- Spot trends in your revenue performance, identify high- and low-performing periods, and adjust advertising, promotions, or pricing to optimize future earnings.
- Recognize trends, understand seasonal variations, and make data-driven decisions to capitalize on upcoming opportunities or to address potential sales challenges.
4. Traffic, ASP, Returns and NetPPM Overview
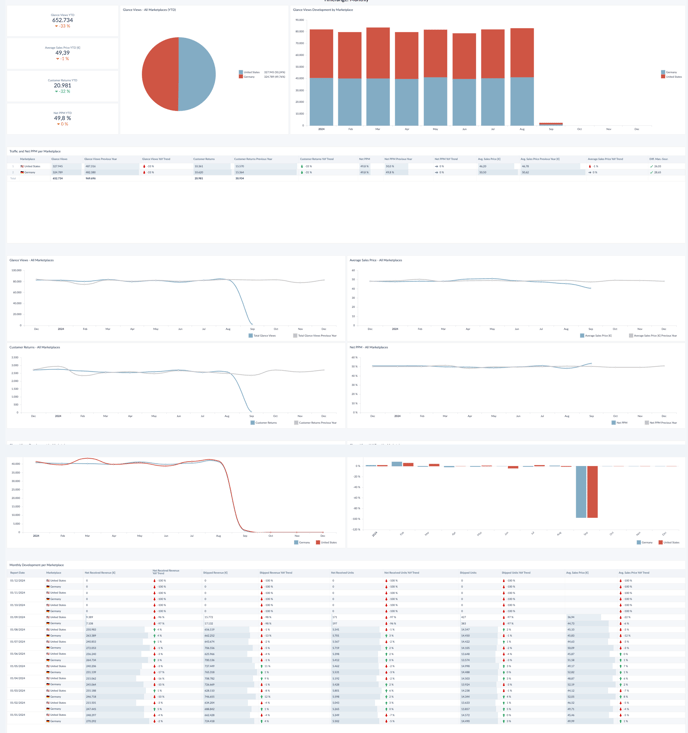
This section gives a detailed view of traffic, returns, Average Selling Price (ASP), and Net PPM. You’ll find the following information:
- Overview Glance Views by Marketplace (MP), offering a quick snapshot of KPIs per region.
- Month-on-Month (MoM) Development Table tracking changes in key metrics.
- Summary Table with additional KPI information for the MPs.
- Development Tables: These cover individual KPIs such as Glance Views, Returns, ASP, and Net PPM across all MPs.
At the bottom of the section, the MoM table provides a summarized view of how these KPIs are performing over time, making it easier to spot trends and anomalies.
Use Case:- Identify if high returns or low pricing are affecting profits, and determine whether changes in pricing or customer engagement are needed to improve sales performance.
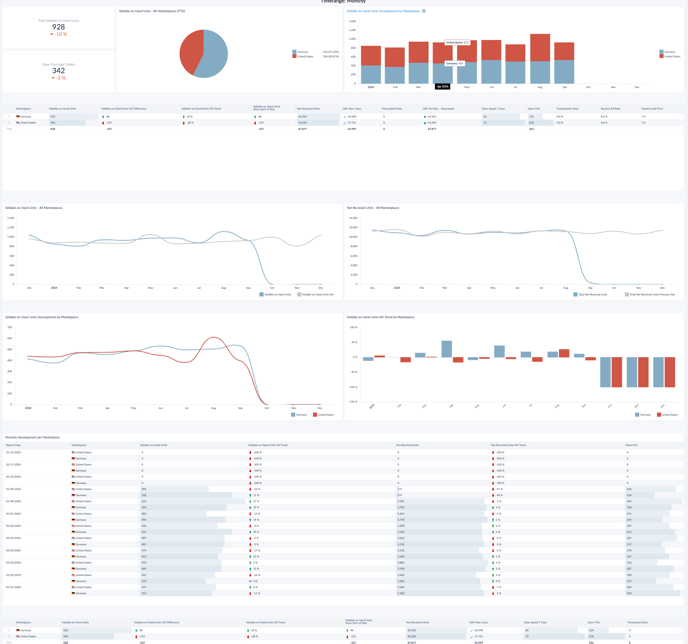
5. Inventory
The Inventory section focuses on your business's stock and sellable units. It contains:
- Sellable on Hand Inventory metric showing the current stock available for sale.
- Net Received Units Trend graph tracking inventory trends over time.
- Development Graphs for more in-depth analysis of inventory movements.
- Month-on-Month (MoM) Development Table summarizing key inventory KPIs.
This section gives a clear view of how well inventory is managed, trends in stock levels, and how it correlates with sales performance and unit availability.
Use Case:
- Keep inventory optimized to avoid understocking or overstocking, ensuring smooth operations and reducing excess costs.
- Ensure inventory is aligned with demand
