1. Introduction to the "Bought Last Month" metric
2. How to calculate your minimum potential
3. Why to use the "Bought Last Month" metric
4. Where to find the metric
1. Introduction to the "Bought Last Month" metric
The "Bought Last Month" metric provides a powerful way to gauge the performance and potential of your products on Amazon. It measures how many times a product was purchased in a given month, with a minimum displayed value of 50 purchases per month (in compliance with Amazon's guidelines).
This metric allows you to:
- Evaluate your brand’s minimum market potential based on sales data.
- Make data-driven investment decisions for your Amazon strategy.
2. How to calculate your minimum potential
Formula for Minimum Potential
You can calculate your minimum potential on the market using this simple formula:
Bought Last Month × Buy Box Price = Minimum Potential![]()
3. Why to use the "Bought Last Month" metric
Using the "Bought Last Month" Metric
The "Bought Last Month" metric is a powerful tool that offers several advantages for brands looking to optimize their Amazon performance. Here’s how it can help you:
1. Strategic Decision-Making
- Identify high-performing keywords—whether generic, branded, or competitor-based—and refine your Amazon strategy.
- Focus on high-potential products to maximize your visibility and sales impact.
- Use data-driven insights to prioritize investments and make smarter business decisions.
2. Brand Protection
- Detect gaps where competitors or other sellers are winning the Buy Box and capturing your sales.
- Take proactive measures to regain the Buy Box and safeguard your market share.
3. Market Growth
- Uncover untapped opportunities by identifying areas with high demand but low coverage.
- Gain a clearer understanding of your brand's potential across various Amazon markets.
4. Understanding Market Potential
- Calculate your minimum market potential using the formula:
Bought Last Month × Buy Box Price = Minimum Potential. - For ASINs with limited data (<50 purchases), use customer ratings to estimate sales and project growth.
Interpreting Data for ASINs with Limited Visibility
For ASINs with fewer than 50 purchases per month (data not shown):
- Use the number of customer ratings to estimate sales.
- Keep projections conservative for better accuracy.
4. Where to find the metric
Visibility Board
The Visibility Board is your go-to tool for tracking and analyzing keyword performance across generic, branded, and competitor categories. It provides:
- Keyword-Specific Market Potential: Assess the total potential for each tracked keyword to identify growth opportunities.

- ASIN-Level Insights: Drill down to see how individual ASINs contribute to the potential of specific keywords.

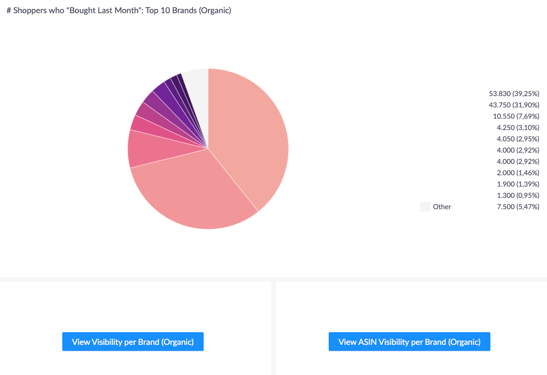
- Top-Performing Brands Graph: Visualize competitive performance with a graph highlighting the leading brands for your tracked keywords.

Brand Overview Board
The Brand Overview Board offers a detailed view of your products’ performance and market potential. It includes:
- Performance Tracking:
Monitor your products’ sales activity and Buy Box ownership to ensure you’re maximizing opportunities.
- Minimum Potential Insights:
Evaluate your brand’s minimum market potential using the formula:
Bought Last Month × Buy Box Price = Minimum Potential.
